What form do the products take?
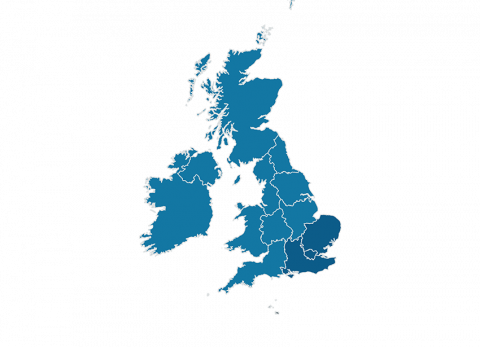
Each region comprises a table & graph for an upgraded 1980s dwelling and 2006 as-built dwelling, ie 2 tables and 2 graphs per region.
Click the links below to view dummy examples of the form the tables and graphs take.
SAP 10.1 version of tables contain all fuels listed in the sample table above
SAP 10.2 version of tables contain all SAP 10.1 fuels plus HVO
How to purchase
Below are the products we offer. To purchase please vist our store page.
Note: You must register before you can make an online purchase.
Once payment has been received you will be provided with access to the file download.
Account holders will receive an email notification as new products.
